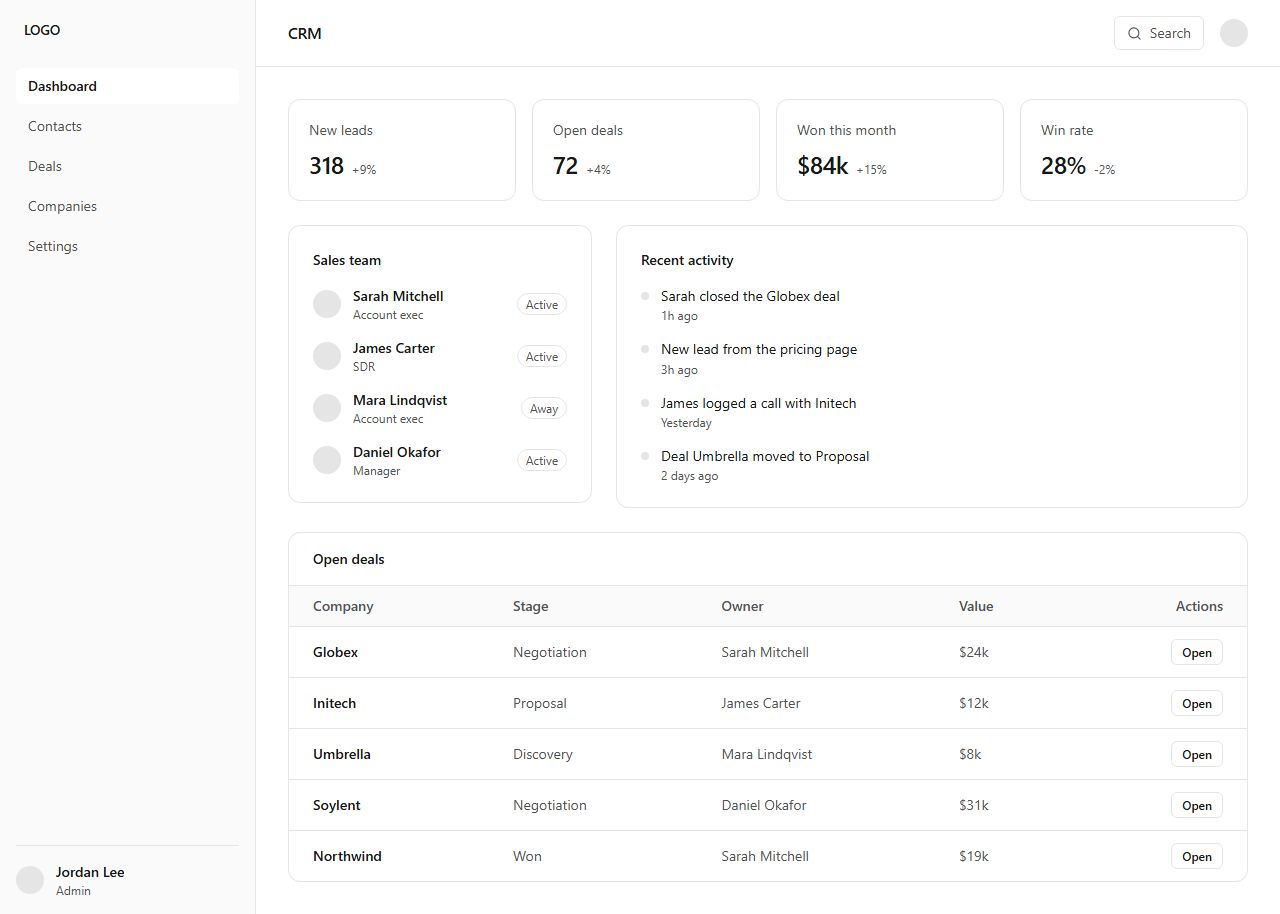
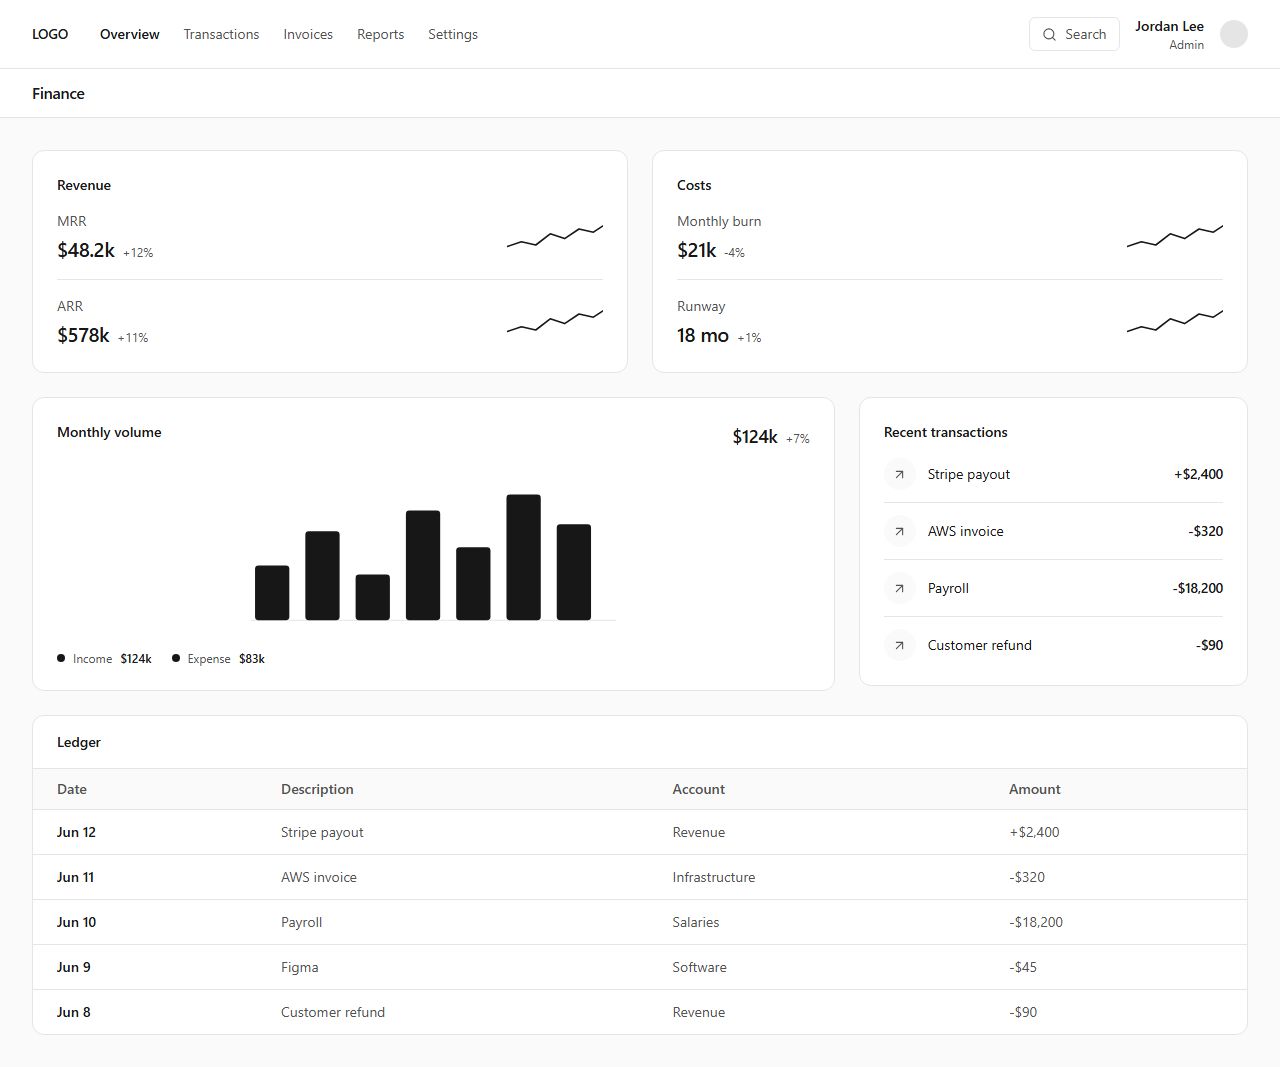
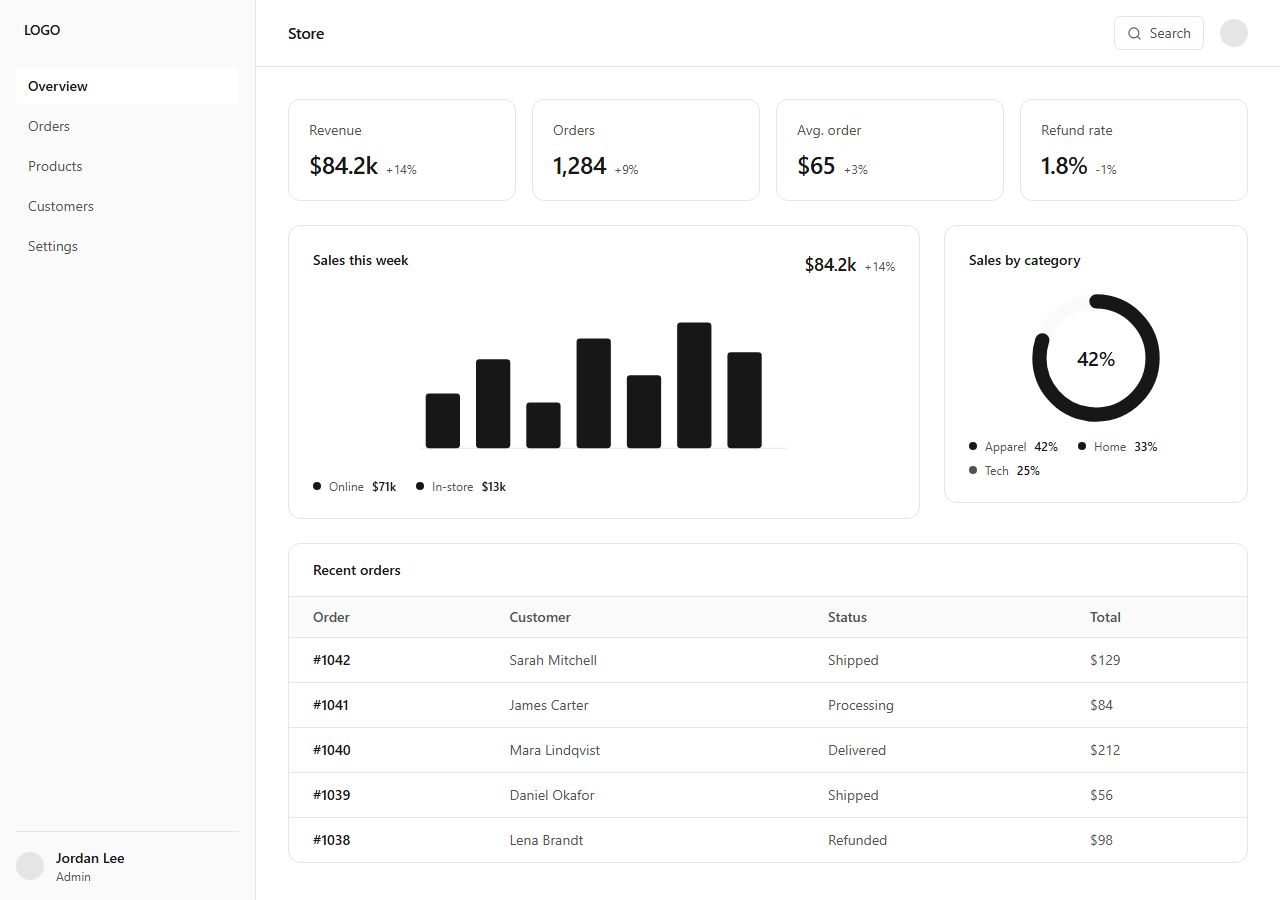
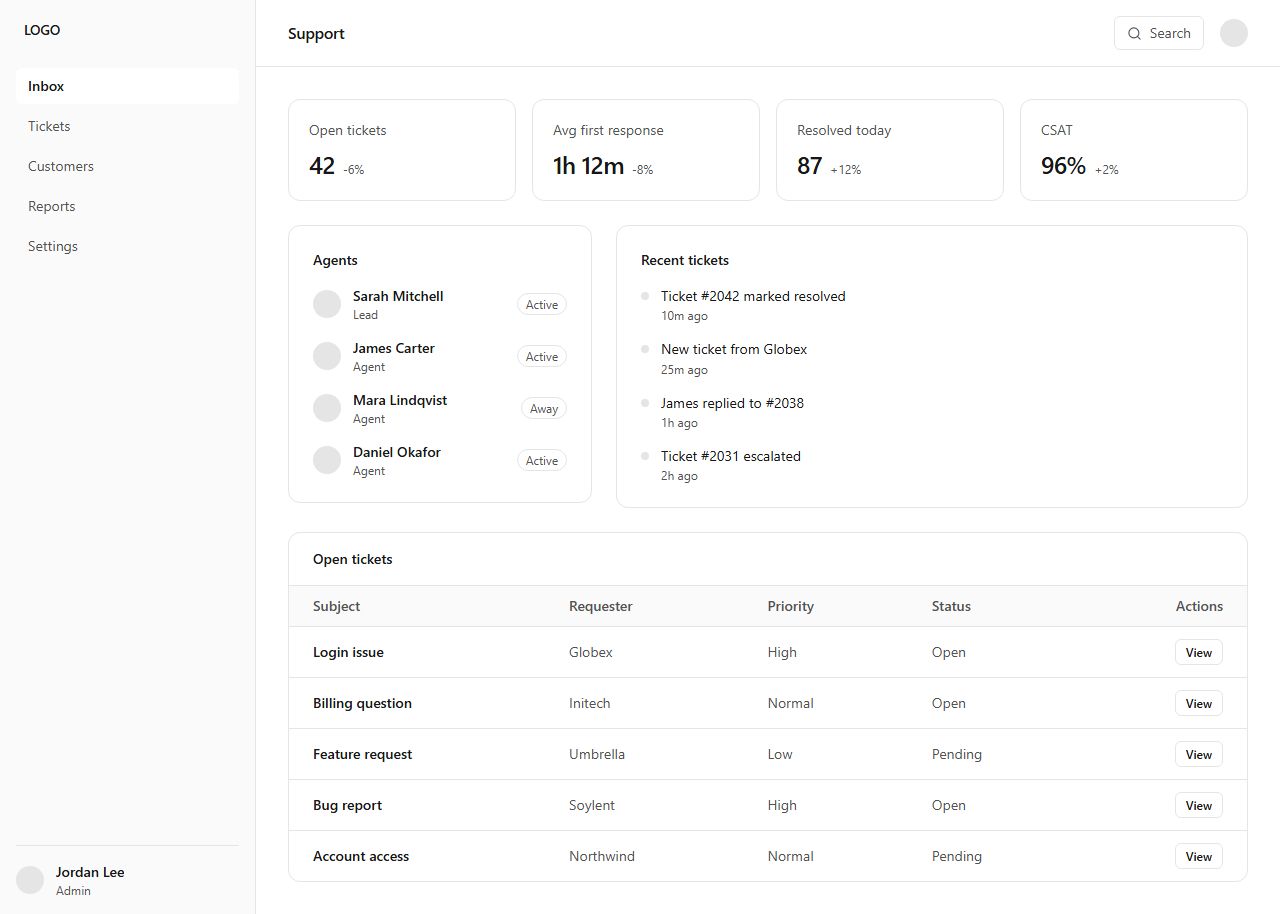
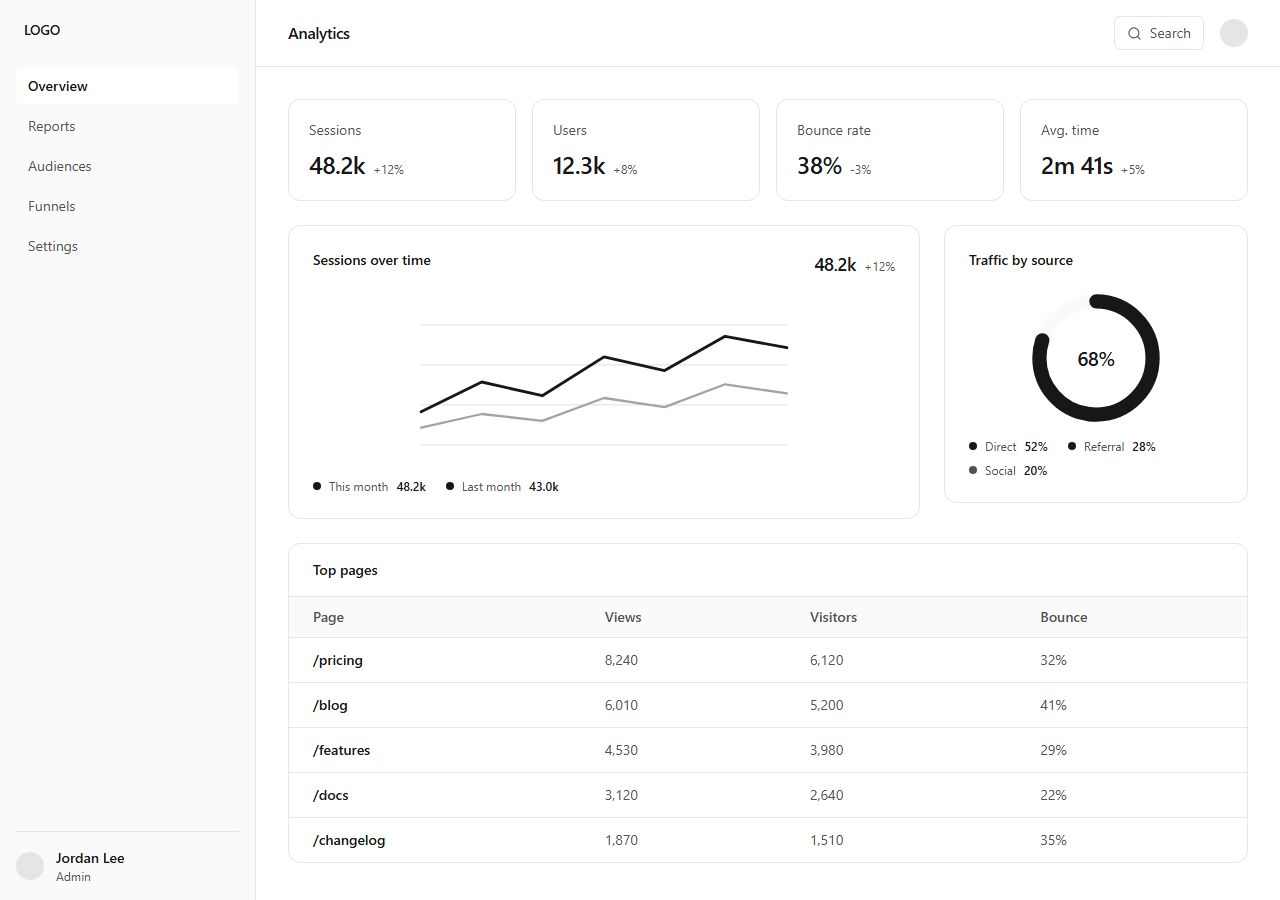
Rifframe
SectionsFor AI agentsDocsPricing
Sections/Dashboard

Dashboard page templates

Complete dashboard pages composed from an app shell and widgets: analytics, CRM and finance presets with KPI rows, charts, feeds and tables arranged on a 12-column grid. Drop-in admin and SaaS back-office screens.

7 variants · neutral wireframe · ready to reskin with your design tokens

Analytics dashboard·CRM dashboard·Finance dashboard·E-commerce dashboard·Support dashboard·Monitoring dashboard·Project management dashboard

Analytics dashboard, dashboard section template

Analytics dashboard

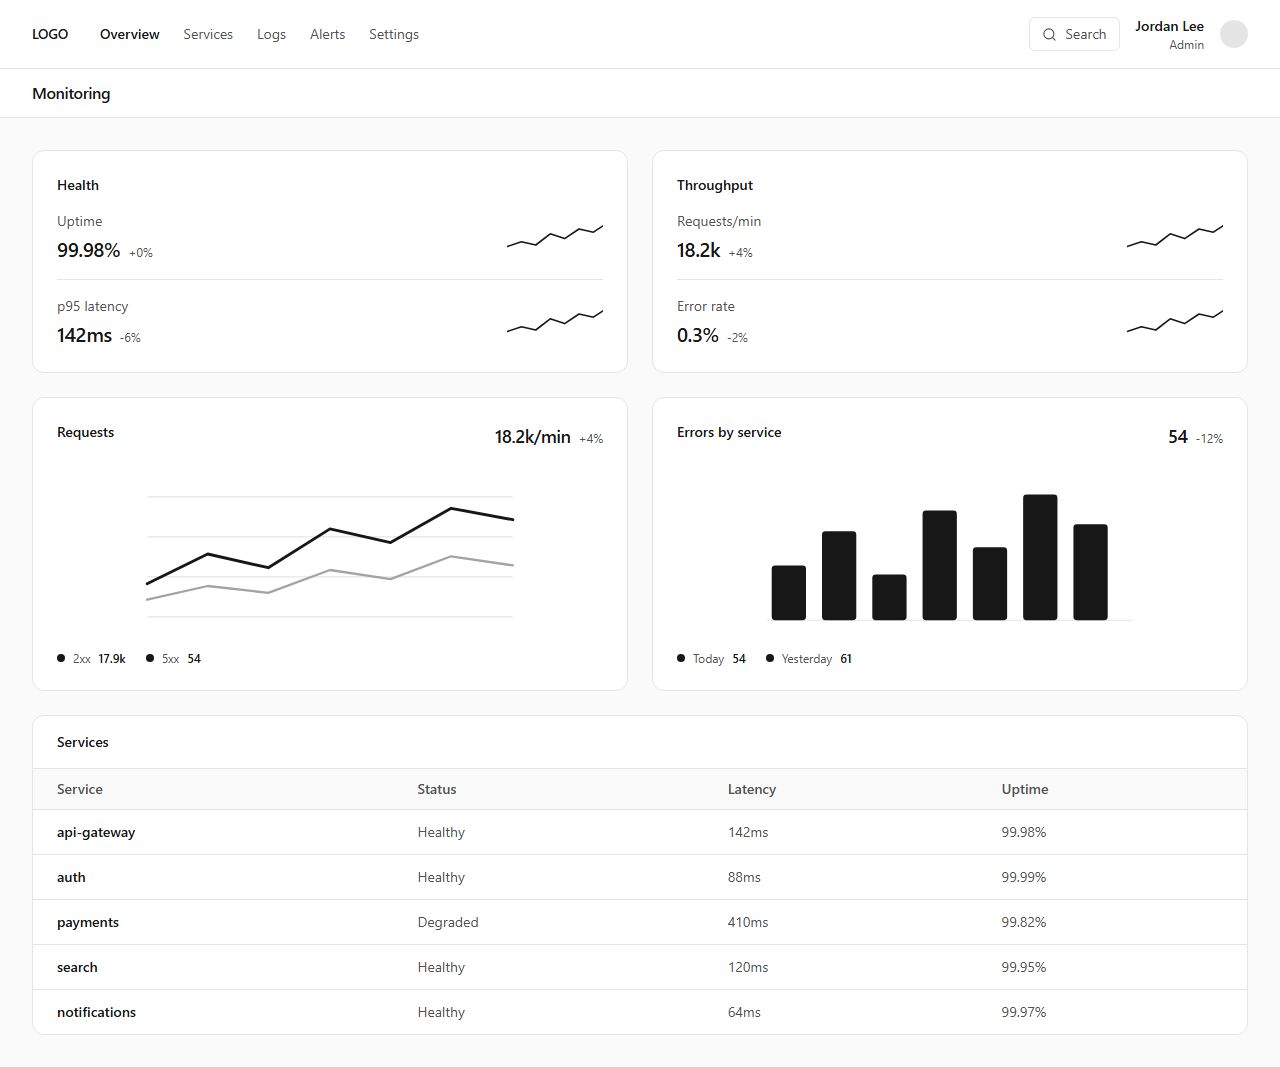
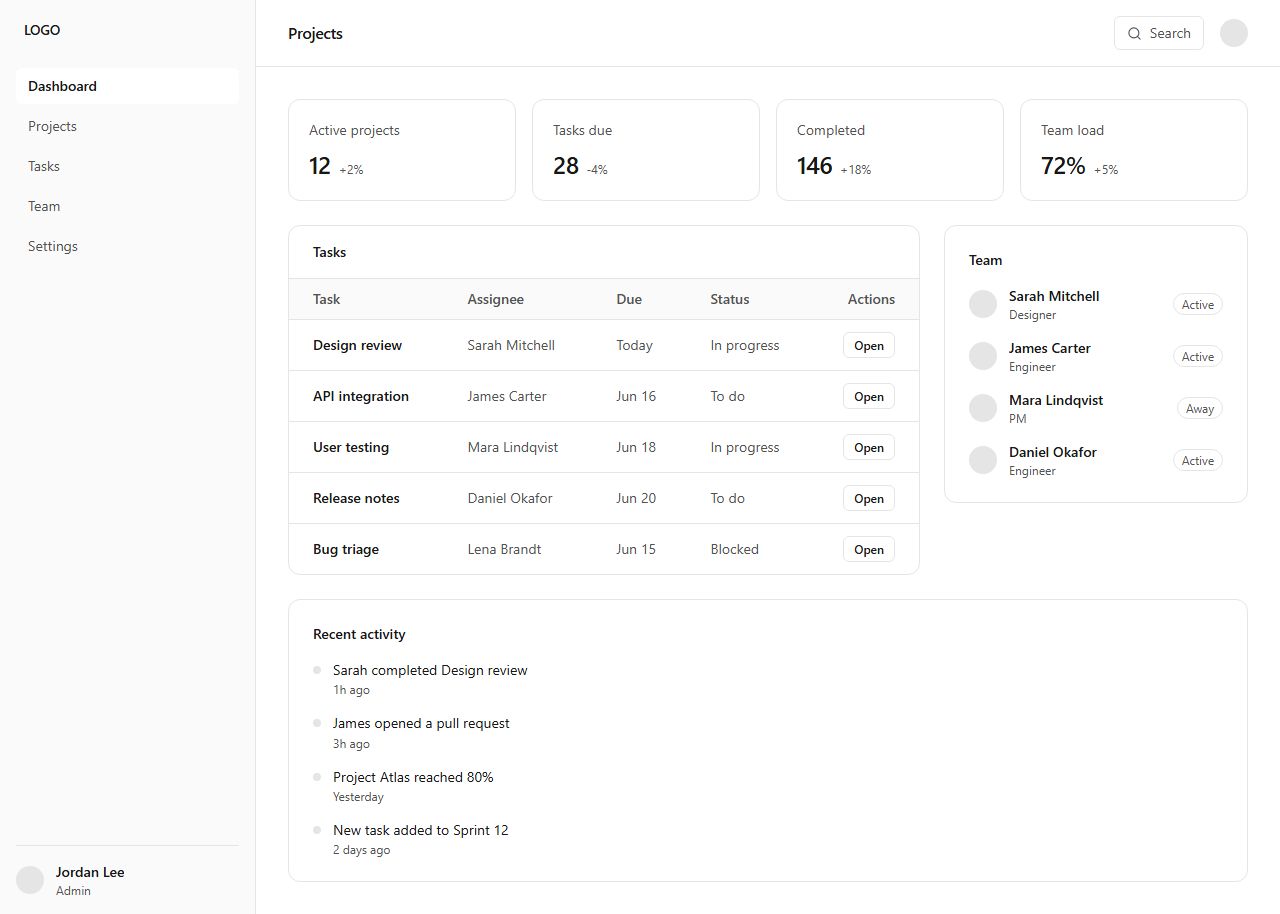
A full analytics dashboard: sidebar app shell with a KPI stat row, a line chart, a donut breakdown, and a top-pages data table laid out on a 12-column grid. A ready-made admin page, not a single widget.

dashboard/analytics/default

Live previewUse in editor
CRM dashboard, dashboard section template

CRM dashboard

A CRM dashboard: sidebar app shell with a KPI stat row, a sales-team list, an activity feed, and an open-deals table with actions. Composed from the shell and widget building blocks.

dashboard/crm/default

Live previewUse in editor
Finance dashboard, dashboard section template

Finance dashboard

A finance dashboard: top-nav app shell with two trend stat panels, a monthly-volume bar chart, a recent-transactions feed, and a ledger table. A complete back-office page.

dashboard/finance/default

Live previewUse in editor
E-commerce dashboard, dashboard section template

E-commerce dashboard

An online-store dashboard: sidebar app shell with a KPI stat row (revenue, orders, AOV), a weekly-sales bar chart, a sales-by-category donut, and a recent-orders table. A ready-made store back office.

dashboard/ecommerce/default

Live previewUse in editor
Support dashboard, dashboard section template

Support dashboard

A helpdesk dashboard: sidebar app shell with a KPI stat row (open tickets, response time, CSAT), an agents list, a recent-tickets feed, and an open-tickets table with actions. A complete support console.

dashboard/support/default

Live previewUse in editor
Monitoring dashboard, dashboard section template

Monitoring dashboard

An ops/devtool monitoring dashboard: top-nav app shell with two trend panels (uptime, latency, throughput), a requests line chart, an errors bar chart, and a services status table. A complete observability page.

dashboard/monitoring/default

Live previewUse in editor
Project management dashboard, dashboard section template

Project management dashboard

A project-management dashboard: sidebar app shell with a KPI stat row, a tasks table with actions, a team list, and a recent-activity feed. A complete project workspace.

dashboard/projects/default

Live previewUse in editor
claude mcp add --transport http rifframe https://rifframe.app/api/mcp

> "Add a dashboard section to my landing page"

Your coding agent can search and pull these sections directly. How it works.

Browse other section types

HeroNavigationAnnouncement barLogosFeaturesHow it worksStatsTestimonialsComparisonResultsIntegrationsUse casesPricingFAQCodeVideoGalleryTeamContactPressSecurityChangelogBlog previewCareersApp downloadProduct gridManifestoLead magnetCTAFooterApp shellWidget
RifframeBuilt by afedb ⚡
Privacy·Terms·Contact·© 2026